Financial reports: complete user guide
Learn how to use financial reports, cash flow reports, and data export in Kamaru.
Financial reports help you monitor income, expenses, occupancy, and overdue payments across all your properties. This guide will show you how to use each section of the reporting feature.
Accessing reports
Tap the Reports icon in the bottom navigation bar to open the Report Overview.
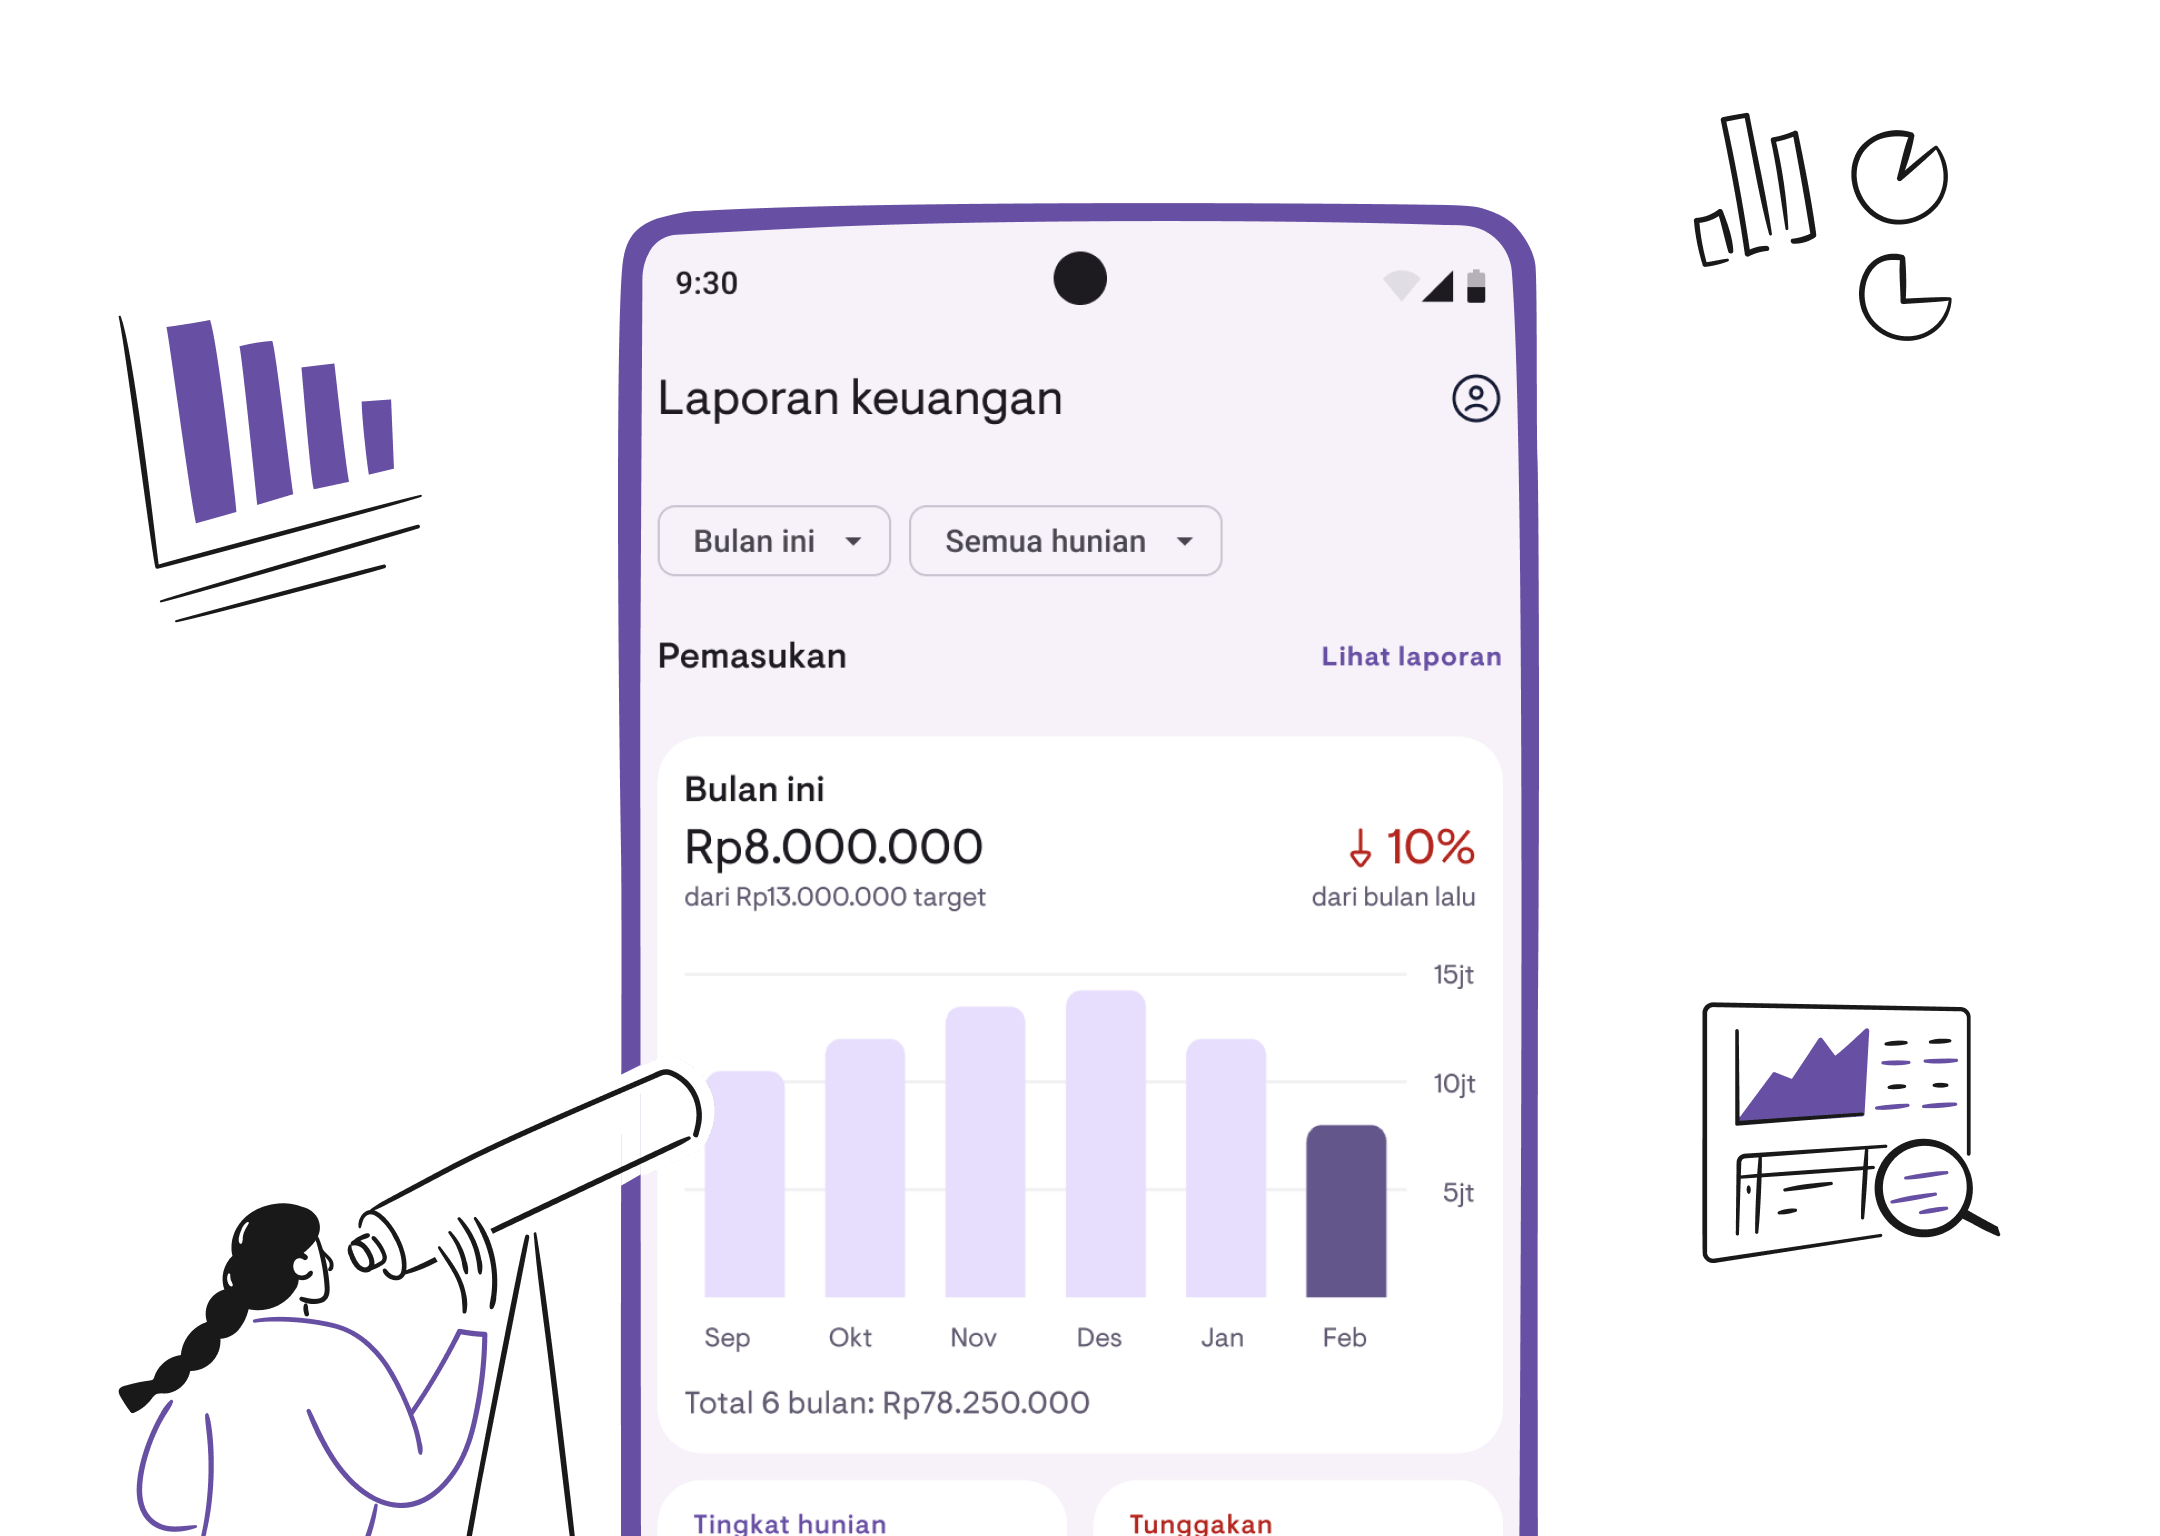
Understanding the Report Overview
The Report Overview displays your property financial summary in a single screen. This feature is available for Pro users—free users will see sample data as a preview.
Income card
- Shows total income for the current period
- Bar chart displays income trends for the last 6 months (“This Month” mode) or 12 months (“1 Year” mode)
- Month-over-month comparison shown as a percentage increase or decrease compared to the previous period
- Comparison against target income (total rent that should have been collected)
Expense card
- Shows total expenses for the current period
- Bar chart displays expense trends for the last 6 or 12 months (red bars)
- Period comparison shown as a percentage increase or decrease compared to the previous period
- Expense transaction count
- If there are no expenses yet, this section shows an illustration with the text “No expenses yet”
Net income card
- Appears only once you’ve recorded expenses
- Shows net income = income − expenses
- Green if positive (profit), red if negative (loss)
- Income and expense breakdown shown below the divider
For a complete expense tracking guide, see the Expense Tracking guide.
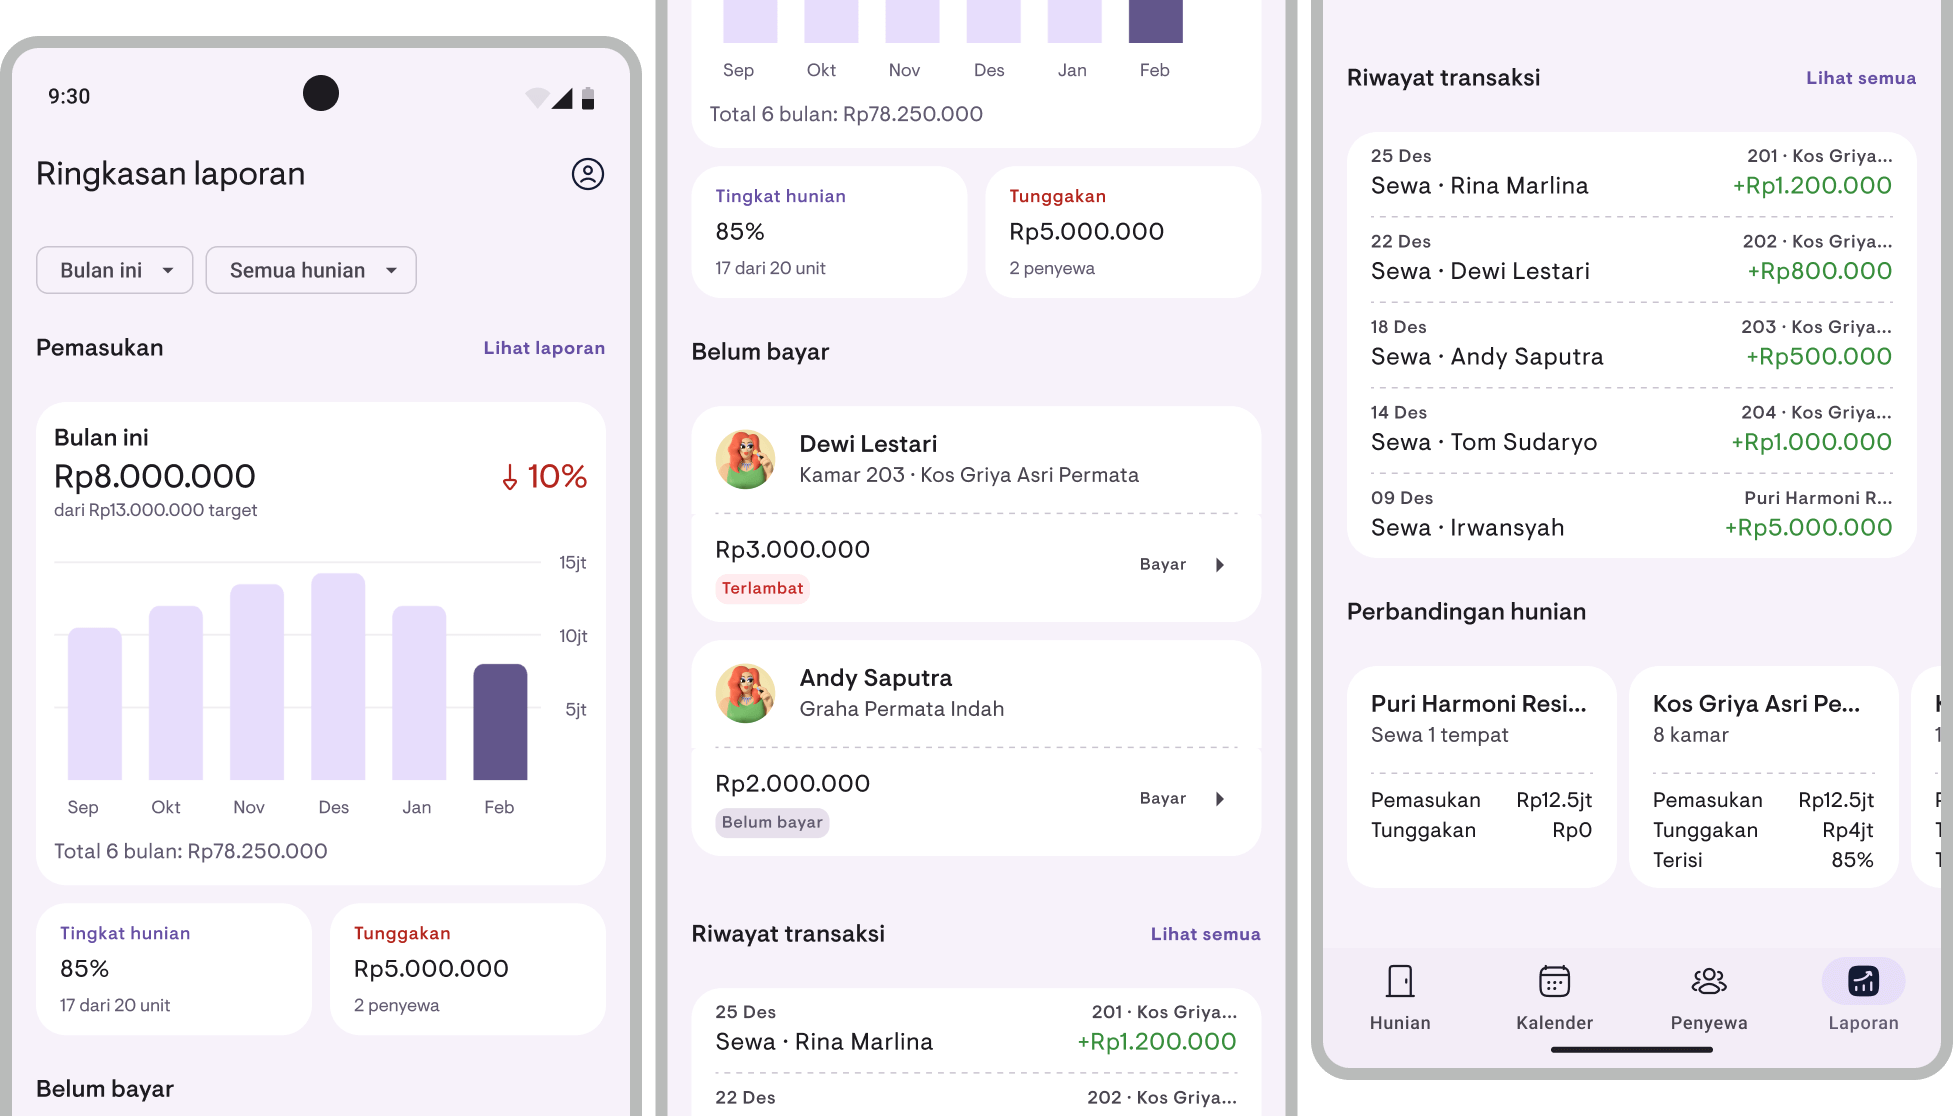
Summary cards
- Occupancy rate — Percentage of occupied units out of total units, with occupied/total count
- Overdue payments — Total unpaid charges, with the number of tenants who are behind
Overdue tenants list
- Shows up to 5 tenants with the highest overdue amounts
- Each item shows tenant name, location, overdue amount, and status badge:
- Overdue (red) — Past the grace period
- Partial (yellow) — Paid but not in full
- Unpaid (gray) — No payment received
- Tap “View All” if there are more than 5 overdue tenants
Recent transactions
- Shows the latest transactions (income and expenses) in one list
- Income shown in green with a ”+” sign, expenses in red with a ”−” sign
- Each transaction shows date, location, description, and amount
Property comparison
- Appears if you have more than one property
- Shows a summary for each property with income, expenses, net profit, overdue amount, and occupancy rate
- Scroll horizontally to see more properties (if 3 or more)
Using filters
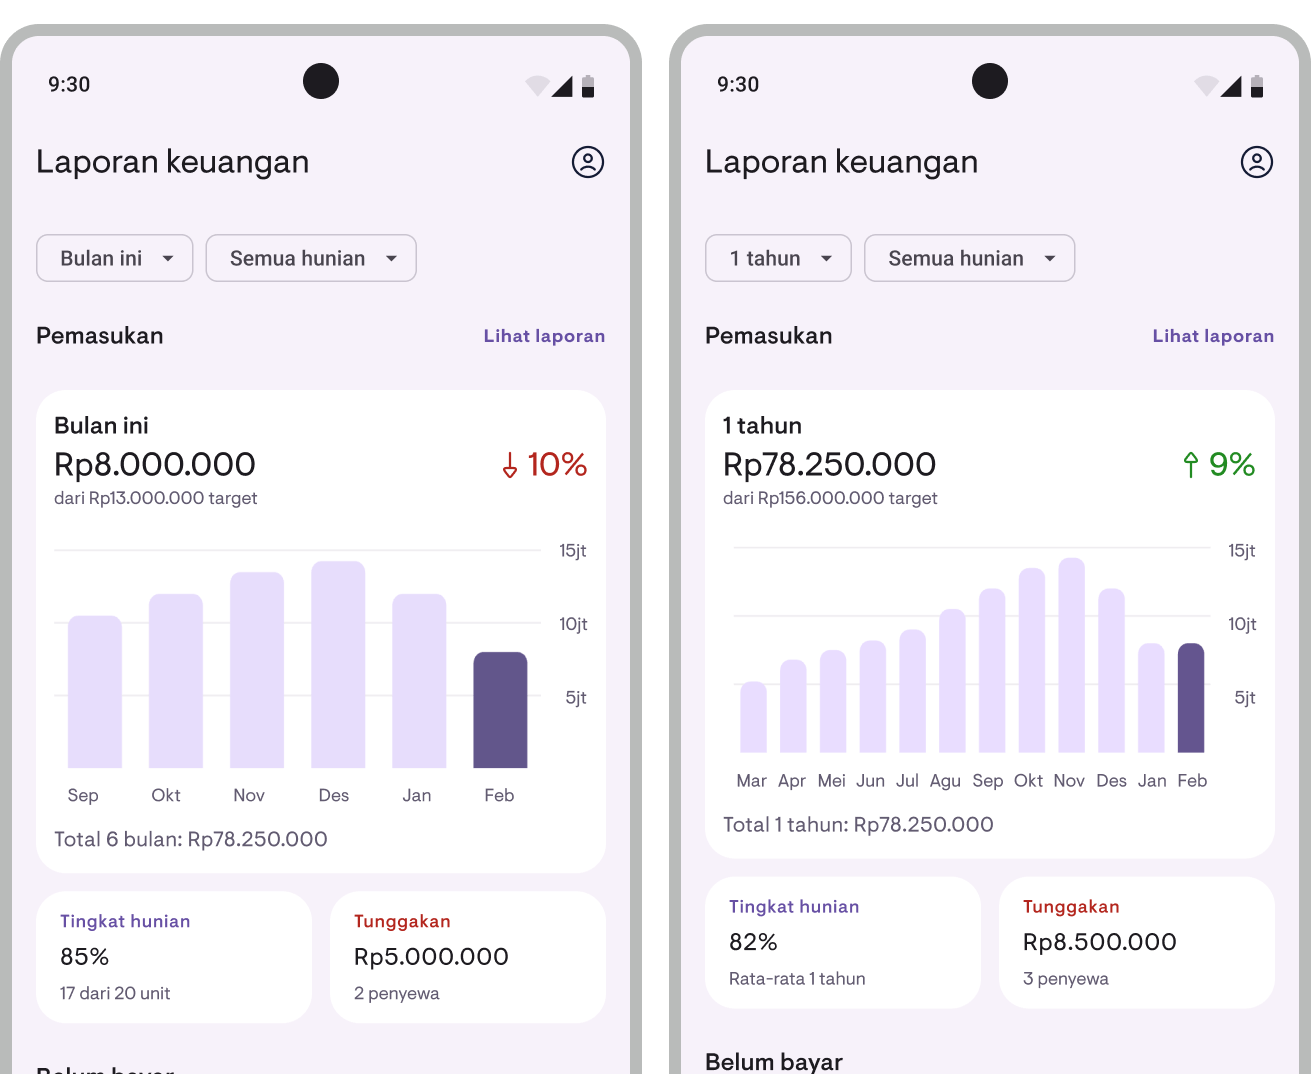
Period filter
- Tap the period chip at the top of the Report Overview
- Choose one:
- This Month — Current month data, chart shows last 6 months
- 1 Year — Rolling 12-month data, chart shows last 12 months
Property filter
- Tap the property chip at the top of the Report Overview
- Select All Properties or choose a specific property
- All data across the Report Overview will update to match the filter
Viewing the financial report
- From the Report Overview, tap View Report in the Income section
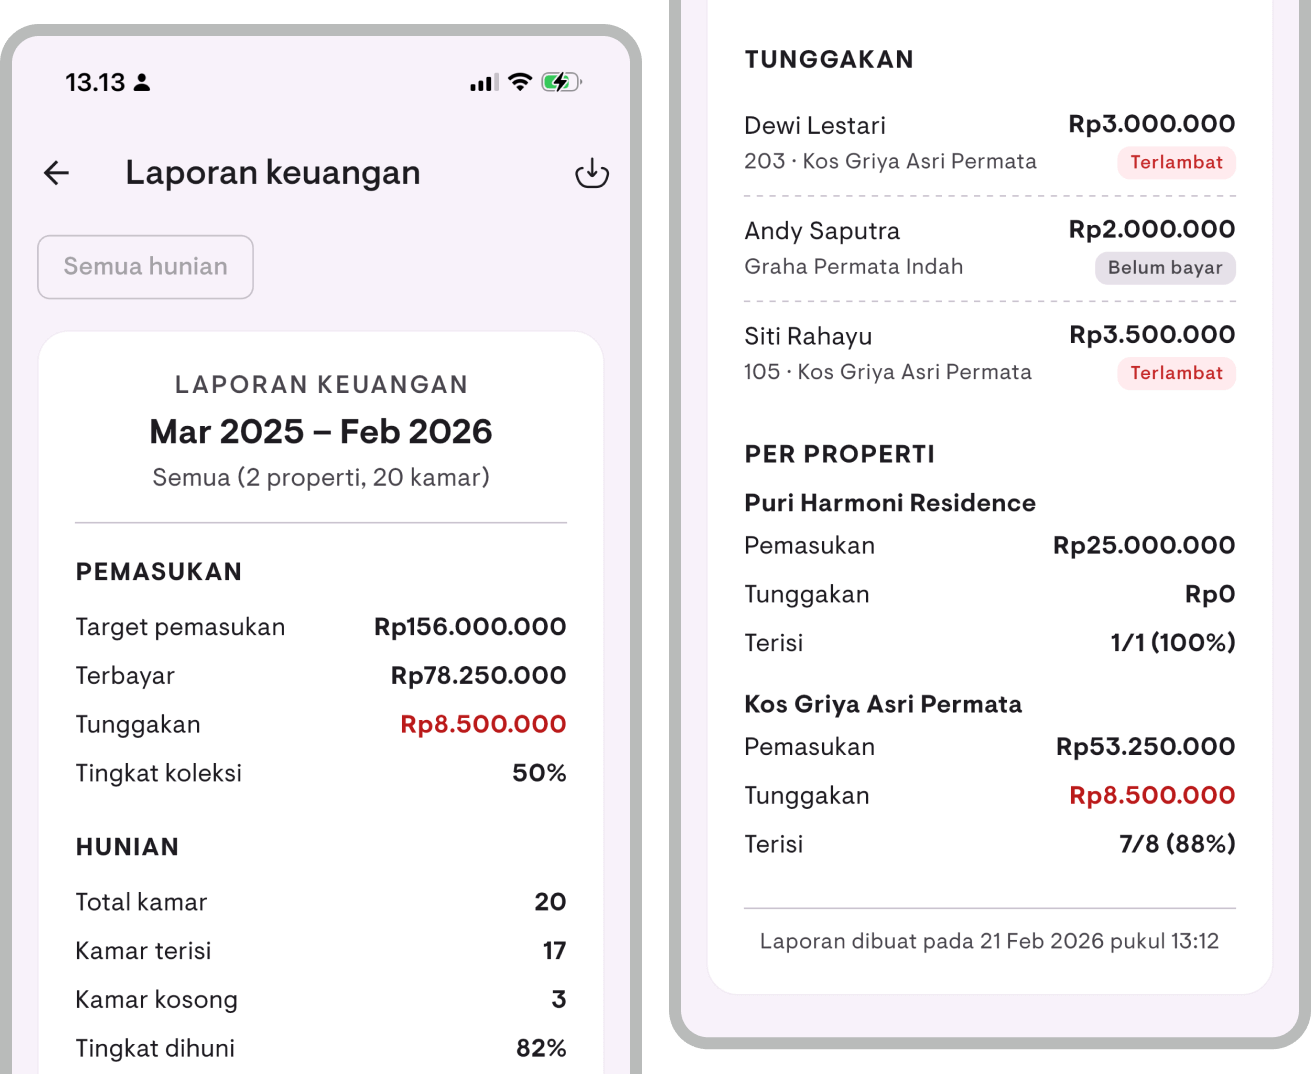
- The financial report page displays:
- Income: Target, collected, overdue, and collection rate (%)
- Expenses: Breakdown by category (sorted largest first) and total expenses
- Net income: Income minus expenses (appears if there are expenses)
- Occupancy: Total rooms, occupied, vacant, and occupancy rate (%)
- Overdue list: All tenants with outstanding charges and full details
- Per-property breakdown: Income, expenses, net profit, overdue amounts, and occupancy for each property
Changing the month
- Tap the month/year header at the top
- Select the month and year you want to view
- The report will update to the selected month
Changing the property
- Tap the property chip at the top
- Select the property you want to view
Viewing the cash flow report
The cash flow report shows detailed income and expense transactions.
- From the Report Overview, tap Cash Flow Report
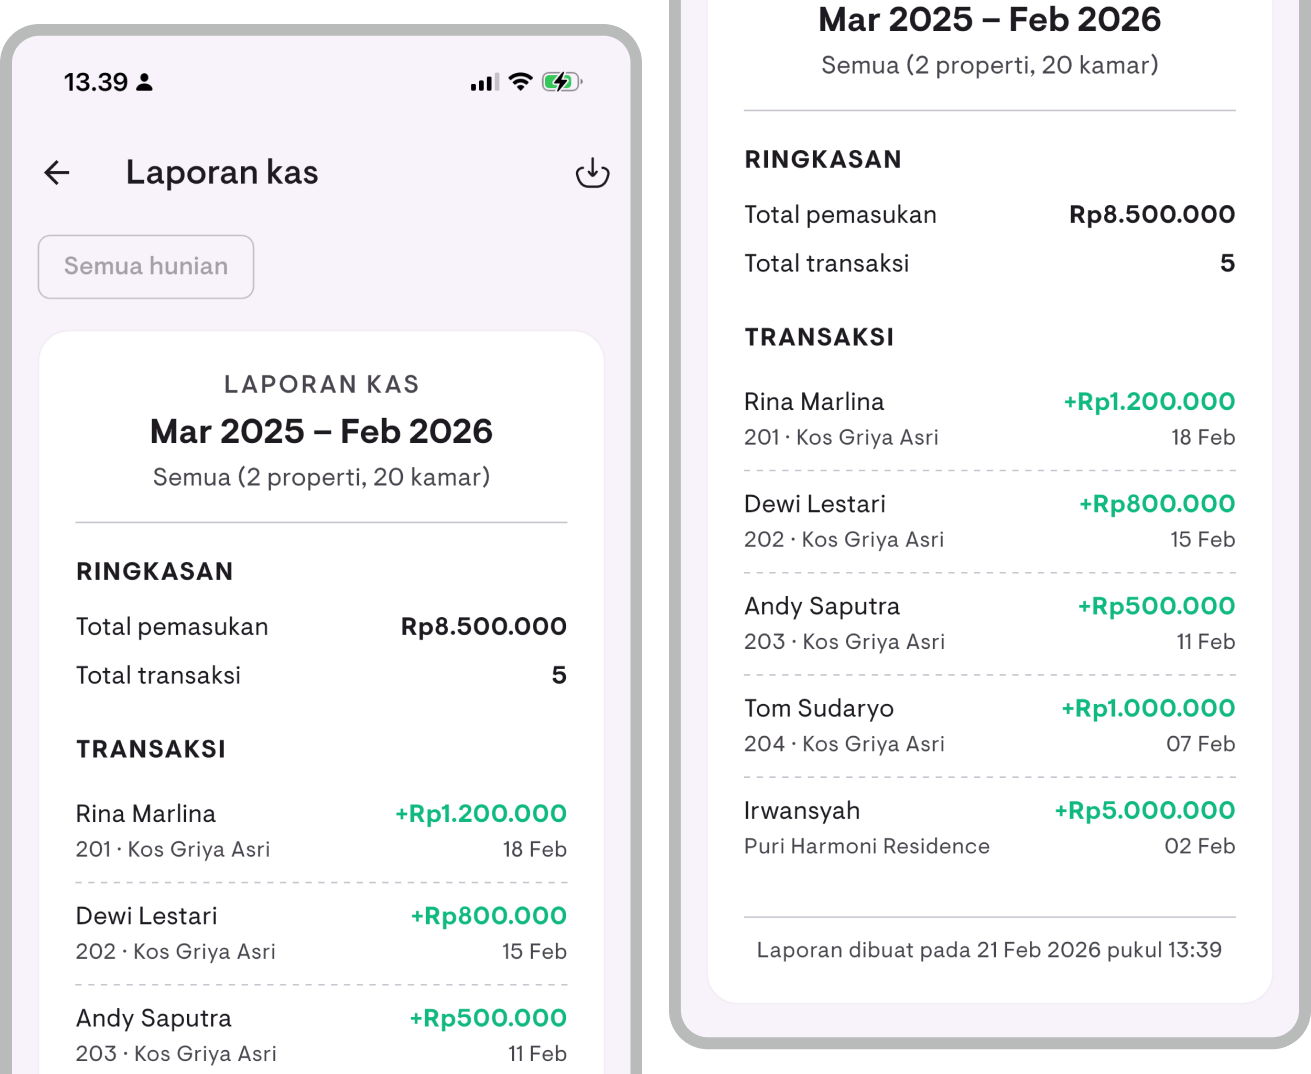
- The cash flow report page displays:
- Summary: Total income, total expenses, net balance, and transaction count
- Transaction list: Mixed income (green, ”+”) and expenses (red, ”−”), sorted newest first
Transaction type filter
- Tap the type filter chip (first chip) at the top
- Choose one:
- All data — Show all transactions
- Income — Income transactions only (rent payments)
- Expenses — Expense transactions only
- The summary will automatically adjust to match the selected filter
Month and property filters are available just like in the financial report.
Exporting reports
You can export the Financial Report and Cash Flow Report in two formats:
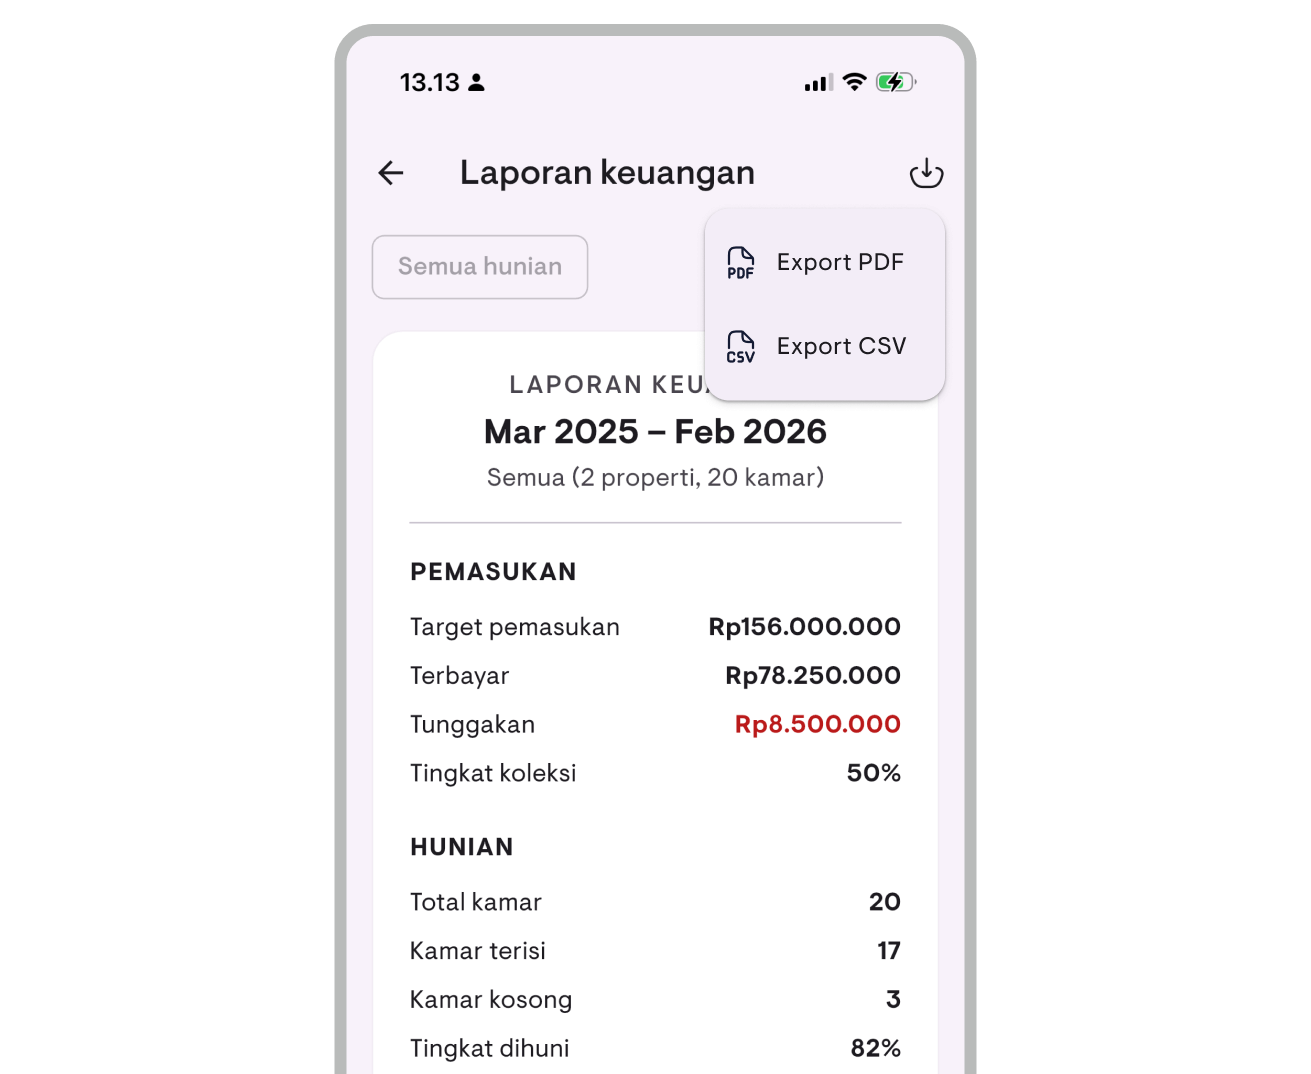
PDF export
- Open the report page you want to export (Financial Report or Cash Flow Report)
- Tap the share button (share icon)
- A PDF file will be generated and your device’s share sheet will open
- Choose to save, send via messaging apps, email, or other apps
CSV export
- Open the report page you want to export
- Tap the download button (download icon)
- A CSV file will be generated and your device’s share sheet will open
- The CSV file can be opened in Excel, Google Sheets, or other spreadsheet apps
Exported files are automatically named with the format: report_[type]_[date].[format]
Tips
- All report features (Report Overview, Financial Report, Cash Flow Report, and export) require a Pro subscription
- Month filter in the Financial Report is separate from the Report Overview filter — you can view a different month without changing the Report Overview
- Bar chart bars can be tapped to see detailed amounts per month
- Data updates automatically every time you record a new payment or expense — no need to manually re-enter data into reports
- Net income only appears once you’ve recorded expenses — start tracking expenses to see your net profit
- For an expense tracking guide, see the Expense Tracking guide
Have questions or feedback? We'd love to hear from you. Email us.

Start managing for free today
Join other landlords who are already using Kamaru to manage their properties.

